Solution
Business intelligence and reporting
Design of analytical models, dashboards and visualisation applications. Development of pipelines that populate reporting tables and semantic layers that define metrics.
Architecture and implementation
Analytical models
Dimensions, metrics and aggregations for data exploration.
Dashboards and visualisation
Power BI, Tableau and Looker dashboards, interactive visualisations and custom analytical applications.
Data publishing
Automated report production and distribution, with APIs and data exports.
Design decisions
Construction of semantic models and datasets for reporting tools. Measure definitions, refresh schedules and access rights are part of the model alongside visualisations.
Illustrative implementation
A dashboard can present current values and history against a common reference date even when sources update on different schedules.
Engineering outputsDatasets, documented measures, dashboards and refresh routines
An Azure platform brings equipment measurements together with business data, retains their history and runs forecasting models. One application is monitoring a group of solar installations, comparing measurements across sites and publishing generation forecasts in dashboards or applications.
 Azure Storage
 Business Central
 Azure Data Factory
 Docker
 .NET
.NET Microsoft Entra ID
 Microsoft Graph
 Power BI
 Python
 Apache Spark
 SQL Server
 Terraform
Components and flows
- Collection of time series, Business Central data and files available through Microsoft Graph
- Retention in Azure Storage, Spark normalisation and loading into SQL Server models
- Python forecasting and publication of historical data and results in Power BI
The storefront records orders in PostgreSQL, publishes their events through Kafka and synchronises them with Business Central. This setup can connect an online shop with central product, inventory and billing management, while sales data feeds a separate analytical history in Snowflake.
- Business Central
 dbt
dbt- Docker
- .NET
 GitHub
 JavaScript
 Apache Kafka
 Kubernetes
 PostgreSQL
- Power BI
- Python
 Redis
Redis Snowflake
Components and flows
- Web access through a .NET API; orders and pending events stored in a PostgreSQL transaction
- Worker publishing to Kafka, followed by order synchronisation with Business Central
- Snowflake history, dbt models and Power BI analysis; Redis caching for frequent requests
A platform connects mobile data collection and Salesforce CRM to a PostgreSQL warehouse, with Tableau analytics and multilingual document search. One application is a programme operating across several countries, bringing locally collected information together with financial records and related documentation in different languages.
- Docker
- .NET
 Infomaniak
 Kotlin
 LangChain
 Microsoft 365
 n8n
n8n- PostgreSQL
- Python
 Salesforce
 Tableau
Components and flows
- Mobile collection through a .NET API and Salesforce CRM integration with programme data
- Python pipelines feeding a PostgreSQL warehouse, with Tableau analytics and API access
- Multilingual search in Microsoft 365 documents, using LangChain and an Infomaniak model API
Development and integration
- Semantic models and metrics
- Interactive visualisation and exploration
- Refresh pipelines and automated publishing
- Web-based analytical applications
Systems involved
- Warehouses and relational databases
- BI tools and spreadsheets
- Portals and business applications
Service lineData →
To go deeper

Choosing a Power BI architecture and licences for an SME
A data warehouse and one shared semantic model keep the figures consistent. The number of readers and the size of the models then decide between per-user licences and a Fabric capacity.
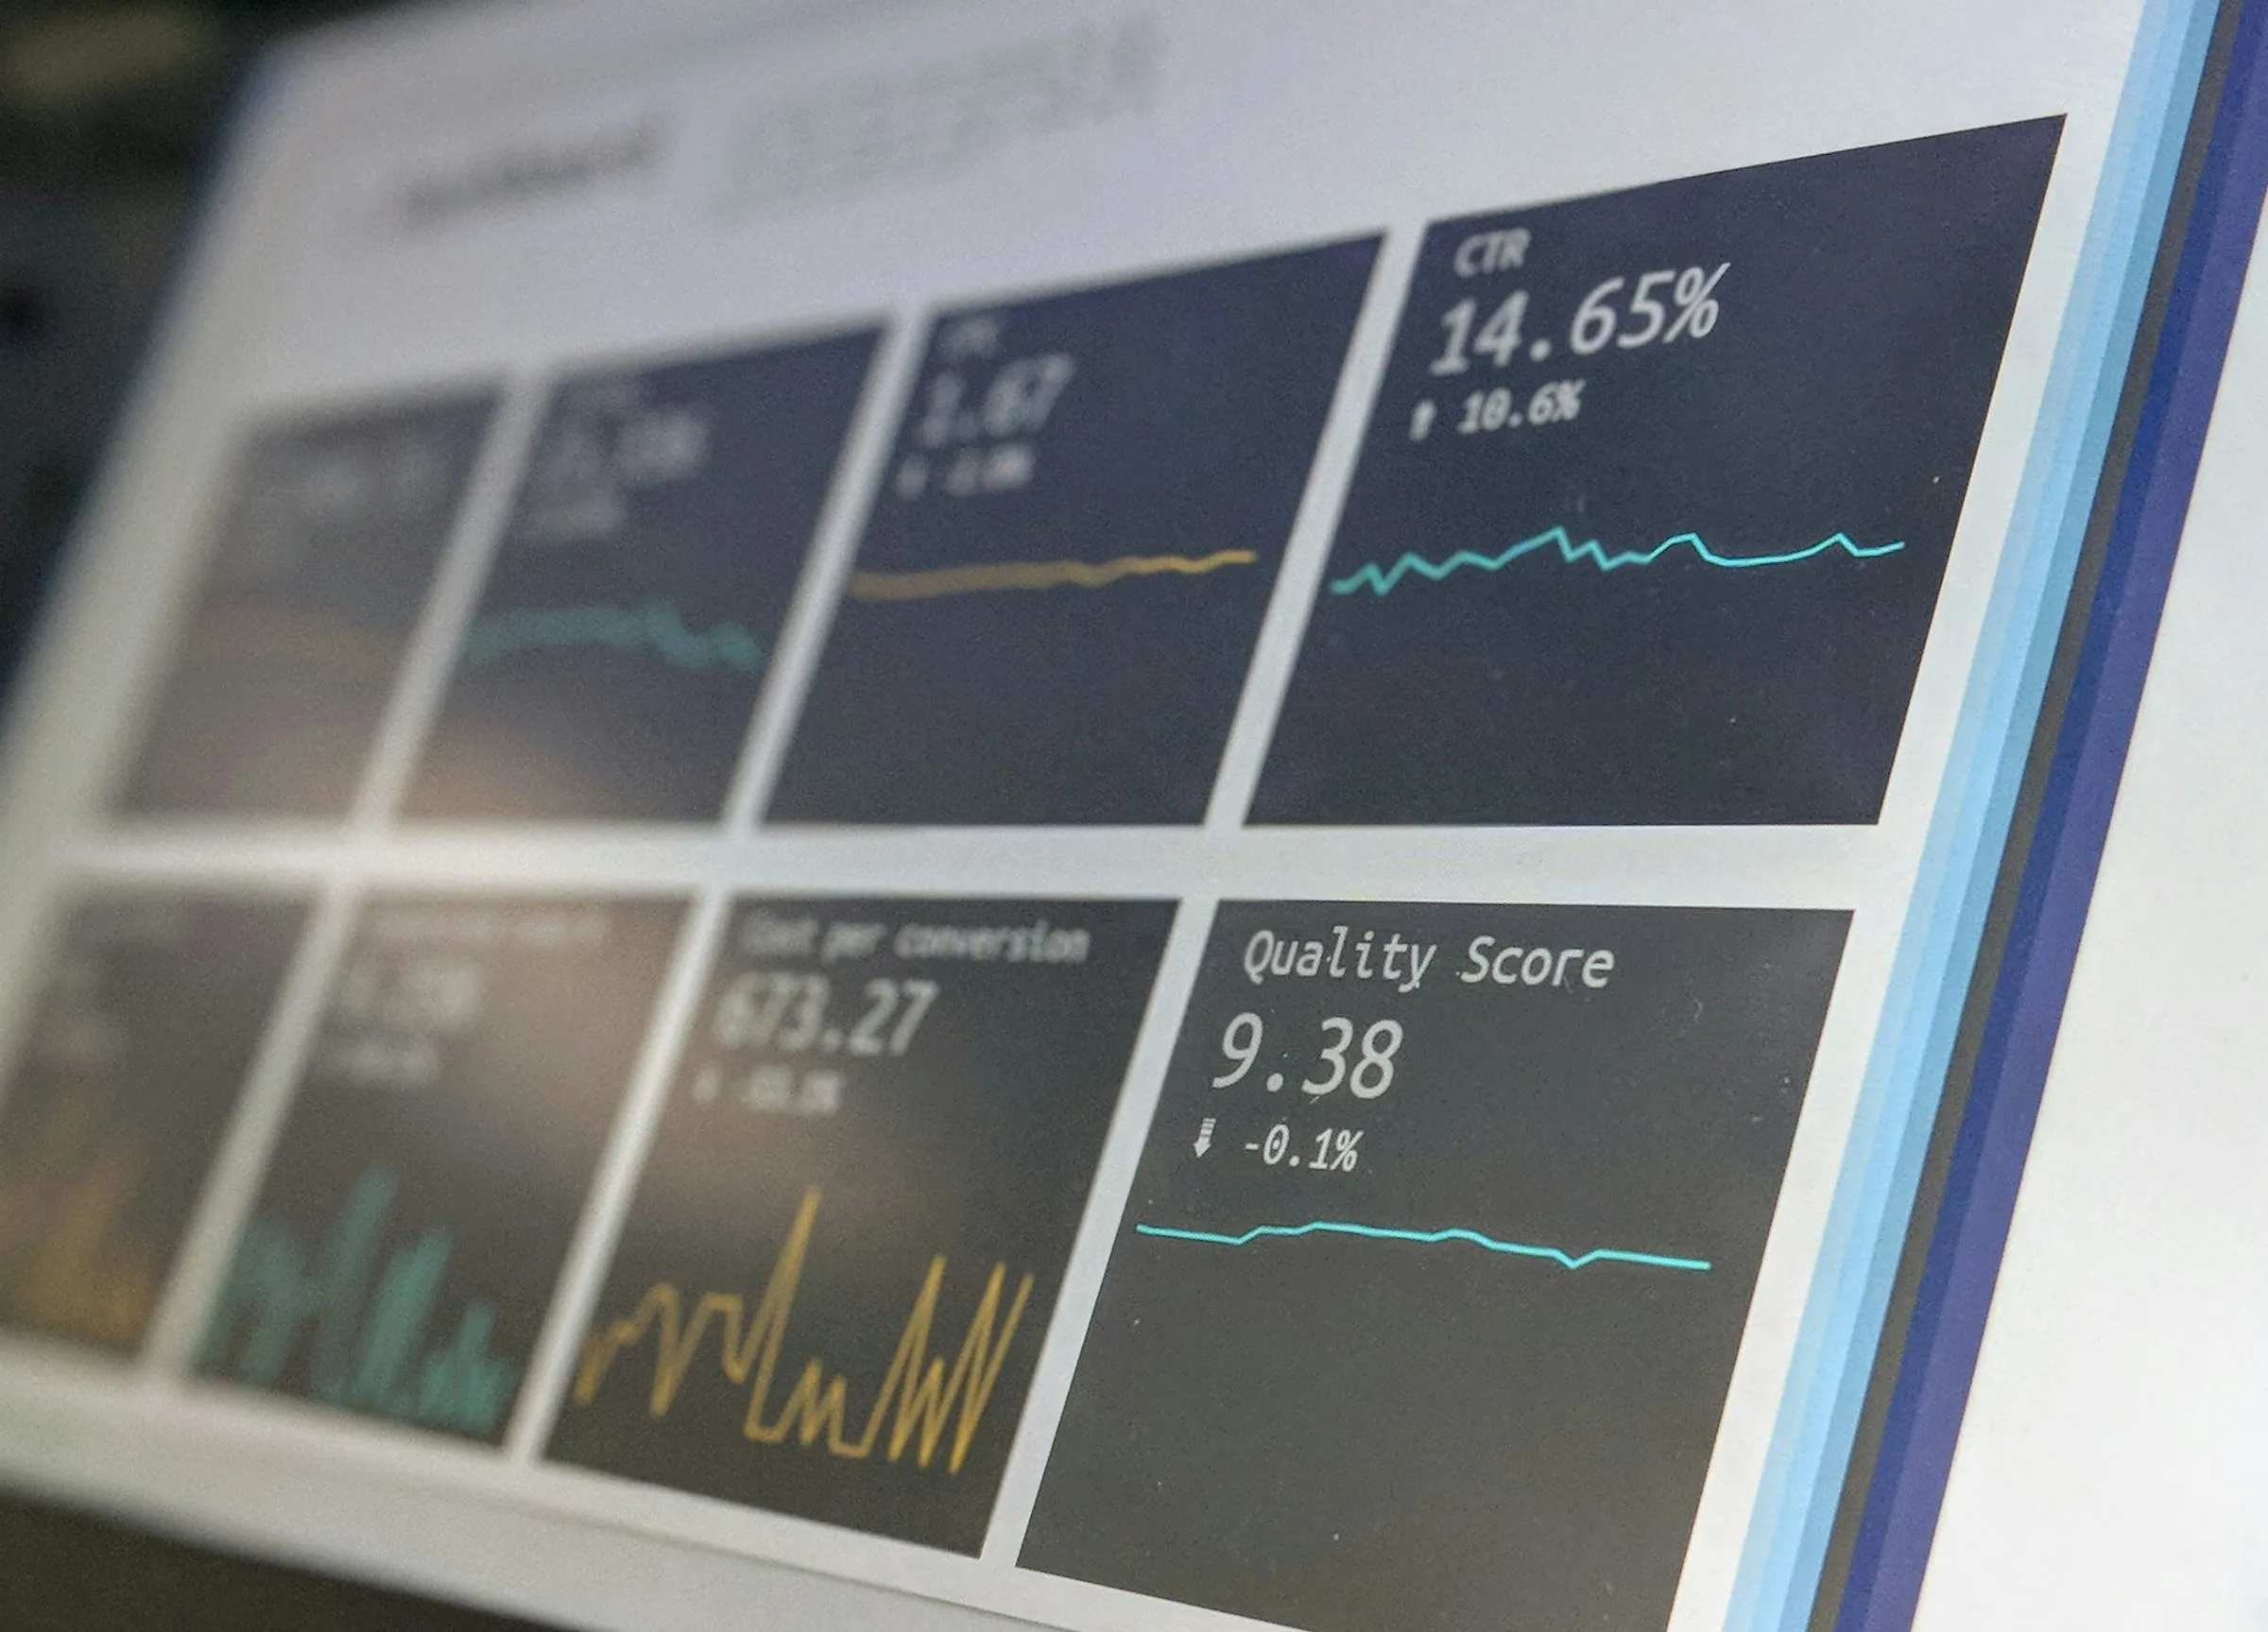
A data platform for analytics, applications and AI
Data models, history and publishing interfaces that connect a data warehouse to analytical queries, applications and predictive models.
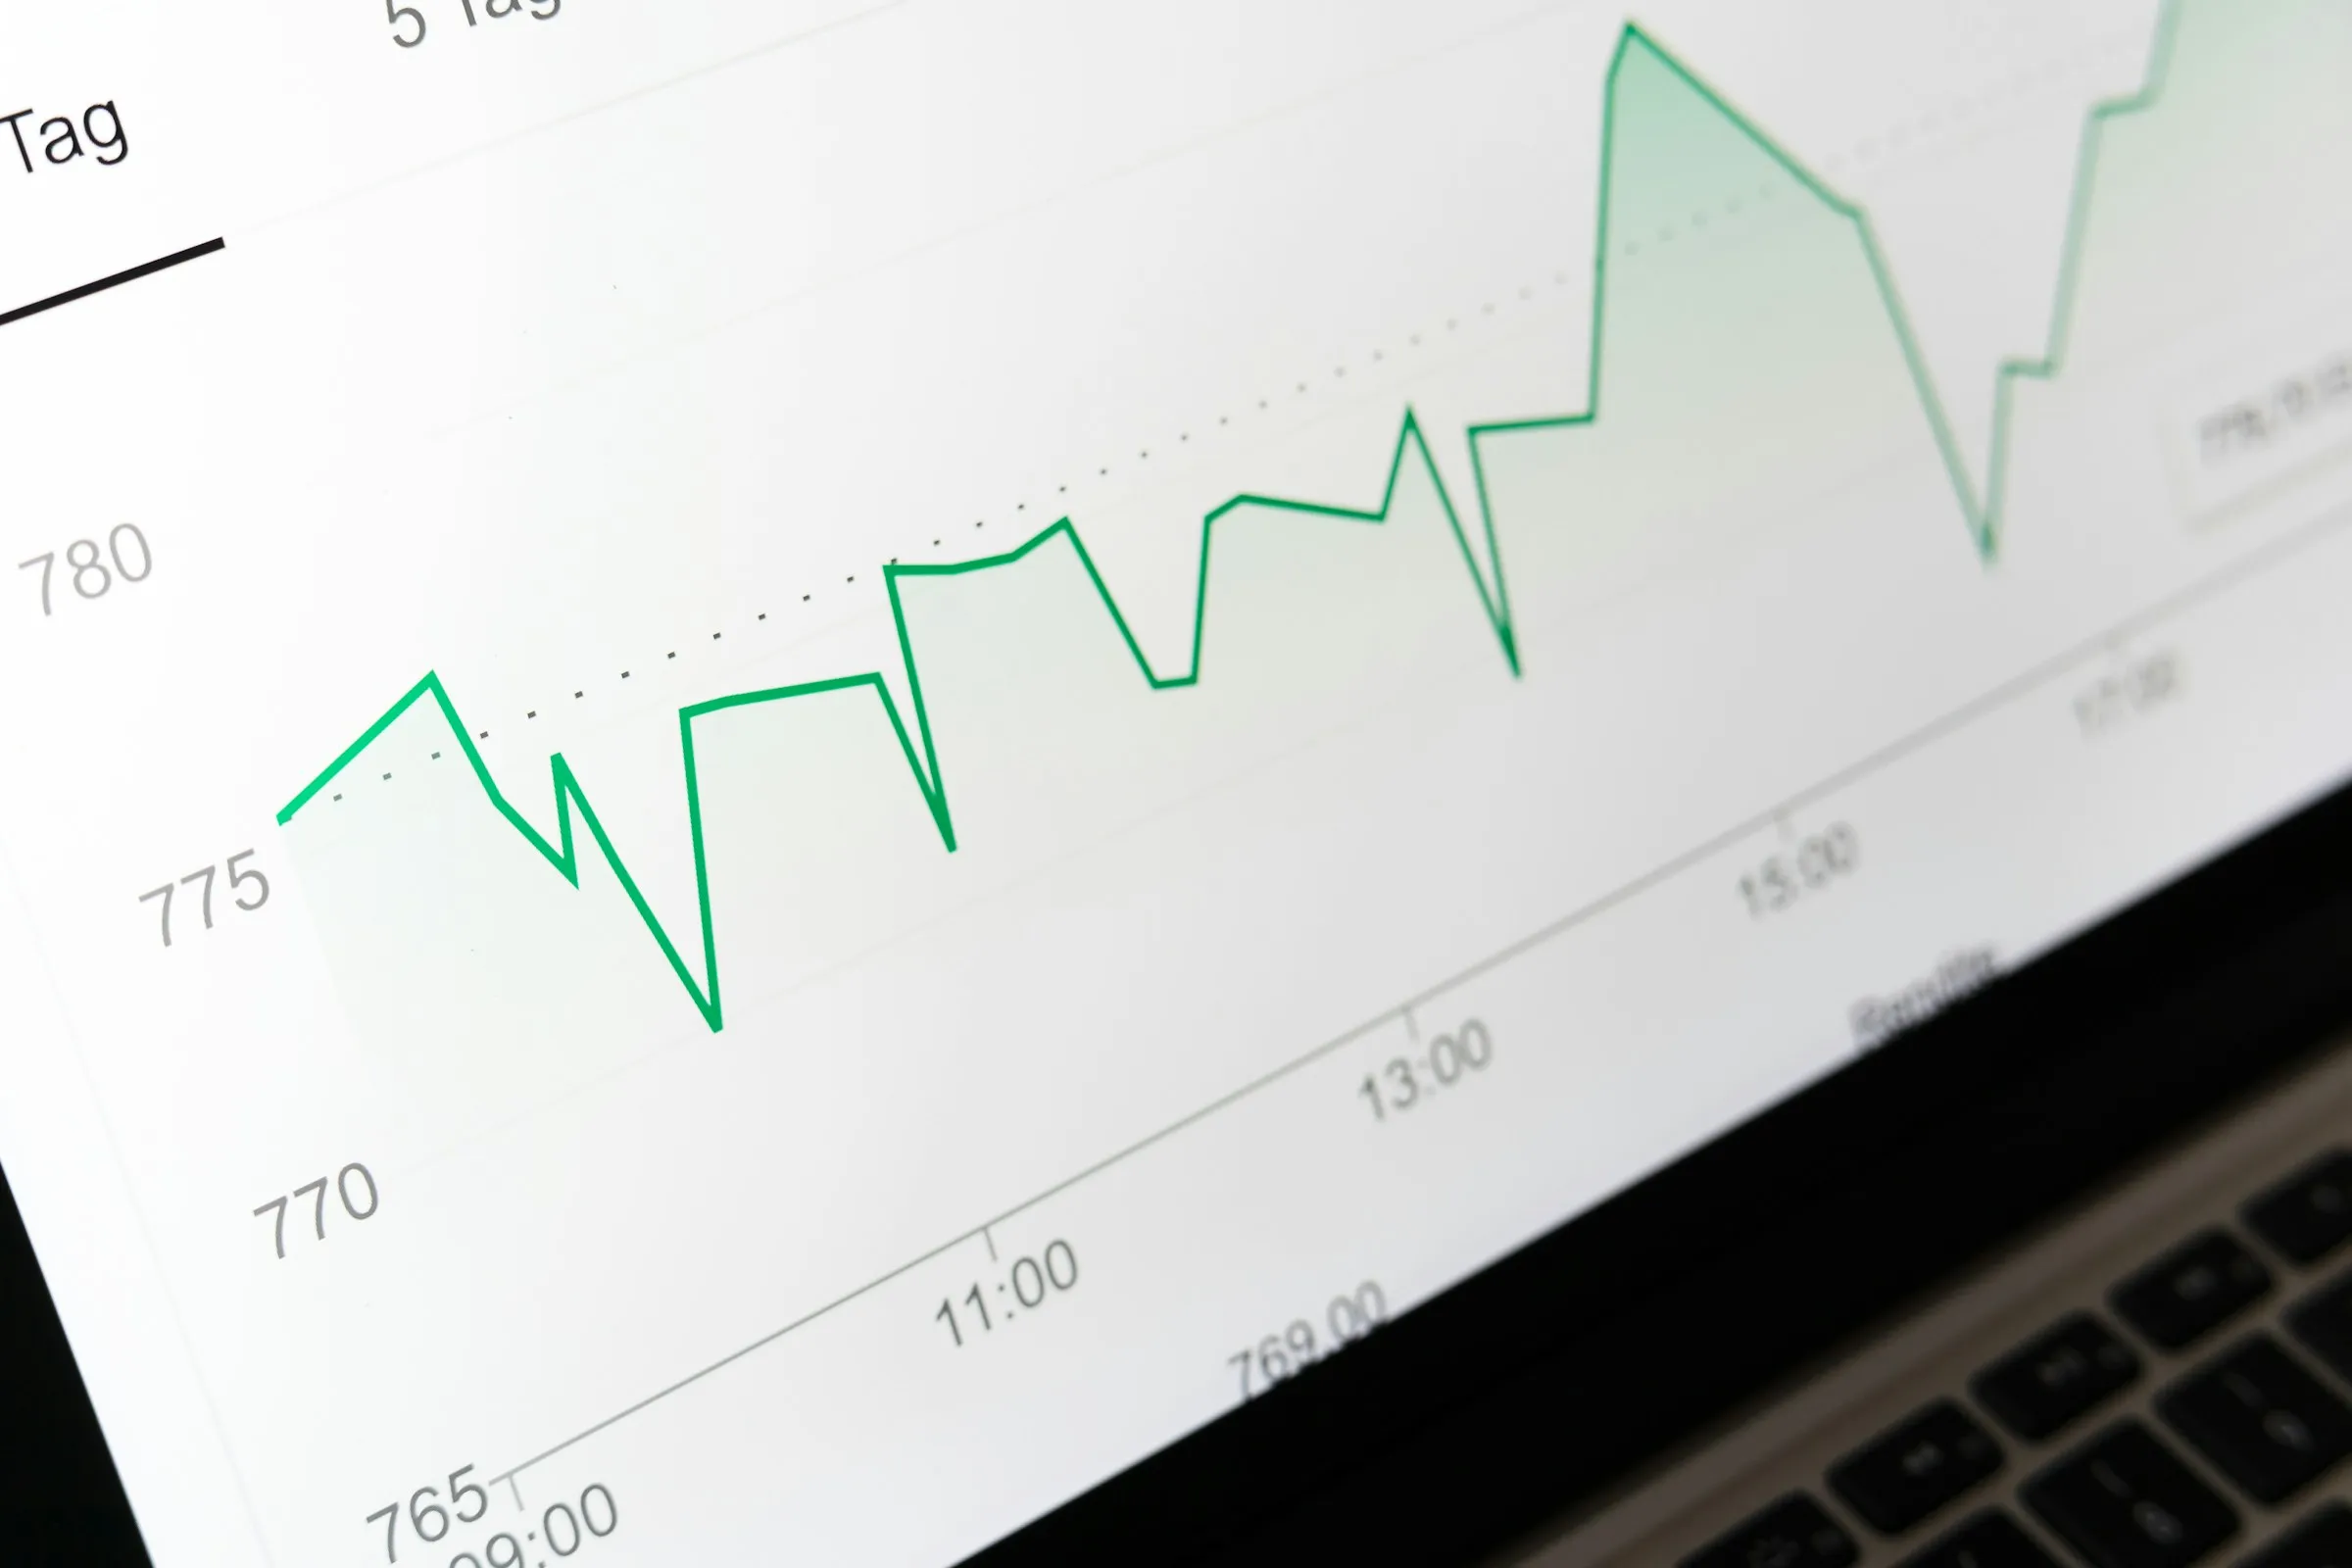
Reliable reporting without replacing every tool
Defined metrics, identifiable sources and a tested first pipeline provide a foundation that teams can explain and extend.
Discuss your project
A discussion of your project’s design, development and production deployment.