Enterprise
Energy and utilities
Data platforms and software for energy generation, consumption and markets. Development of collectors, time-series models, APIs and applications connecting measurements, forecasts, market data and asset management.
Energy measurements, forecasts and transactions
An energy series associates a value with a metering point or zone, a unit and an interval. Forecasts also have a publication time and revisions. The model distinguishes these dimensions to compare generation, consumption and prices for a given period using information available at calculation time.
Examples of data processed in this sector
Measurements and installations
Load profiles, generation, meters and installation references connect measured values with assets and periods.
Forecasts and schedules
Consumption or generation forecasts, schedules and corrections retain their publication times and delivery periods.
Markets and contracts
Prices, volumes, contracts and accounting records provide the commercial and financial dimensions of analysis.
Documented practices and systems in Switzerland
Public sources describing organisational practices and software interfaces. PERINGER project references appear separately below.
Illustrative data-processing flow
Illustrative evaluation of a historical forecast. Selection preserves the version available at a reference time, then compares it with observations for the same interval. The result retains references to the forecast and measurement versions used.
Components and flows
- Select a forecast version by publication time
- Match the metering point or zone, interval and unit
- Calculate the difference and preserve version references
Engineering services
Measurement and market-feed collection
Connectors for provider APIs, files and event feeds. Series identification, unit and interval checks, historical backfill and integration of corrections published after initial receipt.
APIs and systems integration →Time series and data warehouses
SQL models distinguishing publication time, delivery period and data version. Consolidation of generation, consumption, price and contract series into analytical layers accessible to applications.
Data platforms and warehouses →Forecasts and calculation services
Preparation of training and evaluation datasets, comparison of forecasts with observations and calculation APIs. Parameters and input data are retained for each execution.
Predictive analytics and anomaly detection →Applications and operational interfaces
Web applications, portals and dashboards for series, assets and calculation results. Integration of alerts and business data with filters by site, period and source.
Custom software and applications →Processing deployment and monitoring
Containerised services, scheduled jobs and cloud or private pipelines. Collection, delay and error monitoring, with processing recovery and database-update checks.
Infrastructure automation →
Data protection and system security
The data-protection framework depends on the organisation’s status and processing activities. For processing subject to the revised Swiss Federal Act on Data Protection (FADP), security measures and protective defaults are defined from the design stage according to risk.
Consumption data can relate to identifiable individuals. Processing takes account of the FADP and electricity-metering rules. Covered critical-infrastructure operators have separate cybersecurity and reporting obligations to assess. The analytical platform has its own access permissions for equipment data. Official source
Technical measures to define for the processing involved
- Separate access to metering systems, data platforms and administration services
- Timestamp, unit and revision checks, with load and correction history
- API-account protection, backups and collection recovery after interruption
Technical guidance · FDPIC · NCSC
Legal framework, providers and incidents
Purposes, retention and rights
The design specifies the data collected, its uses, recipients and retention periods. It provides for information to individuals and handling of access or rectification requests. Record-keeping and documentation duties are assessed against the processing involved and applicable exemptions.
Hosting and processors
An organisation remains responsible when it entrusts data to a provider. The assessment covers contracts, subprocessors, processing locations and access from abroad. Hosting outside Switzerland is possible subject to the applicable transfer safeguards.
Risk assessment and incidents
A data protection impact assessment (DPIA) is required when planned processing is likely to pose a high risk to individuals. The controller reports a data security breach to the FDPIC as soon as possible when it is likely to create a high risk to their personality or fundamental rights.
Related projects
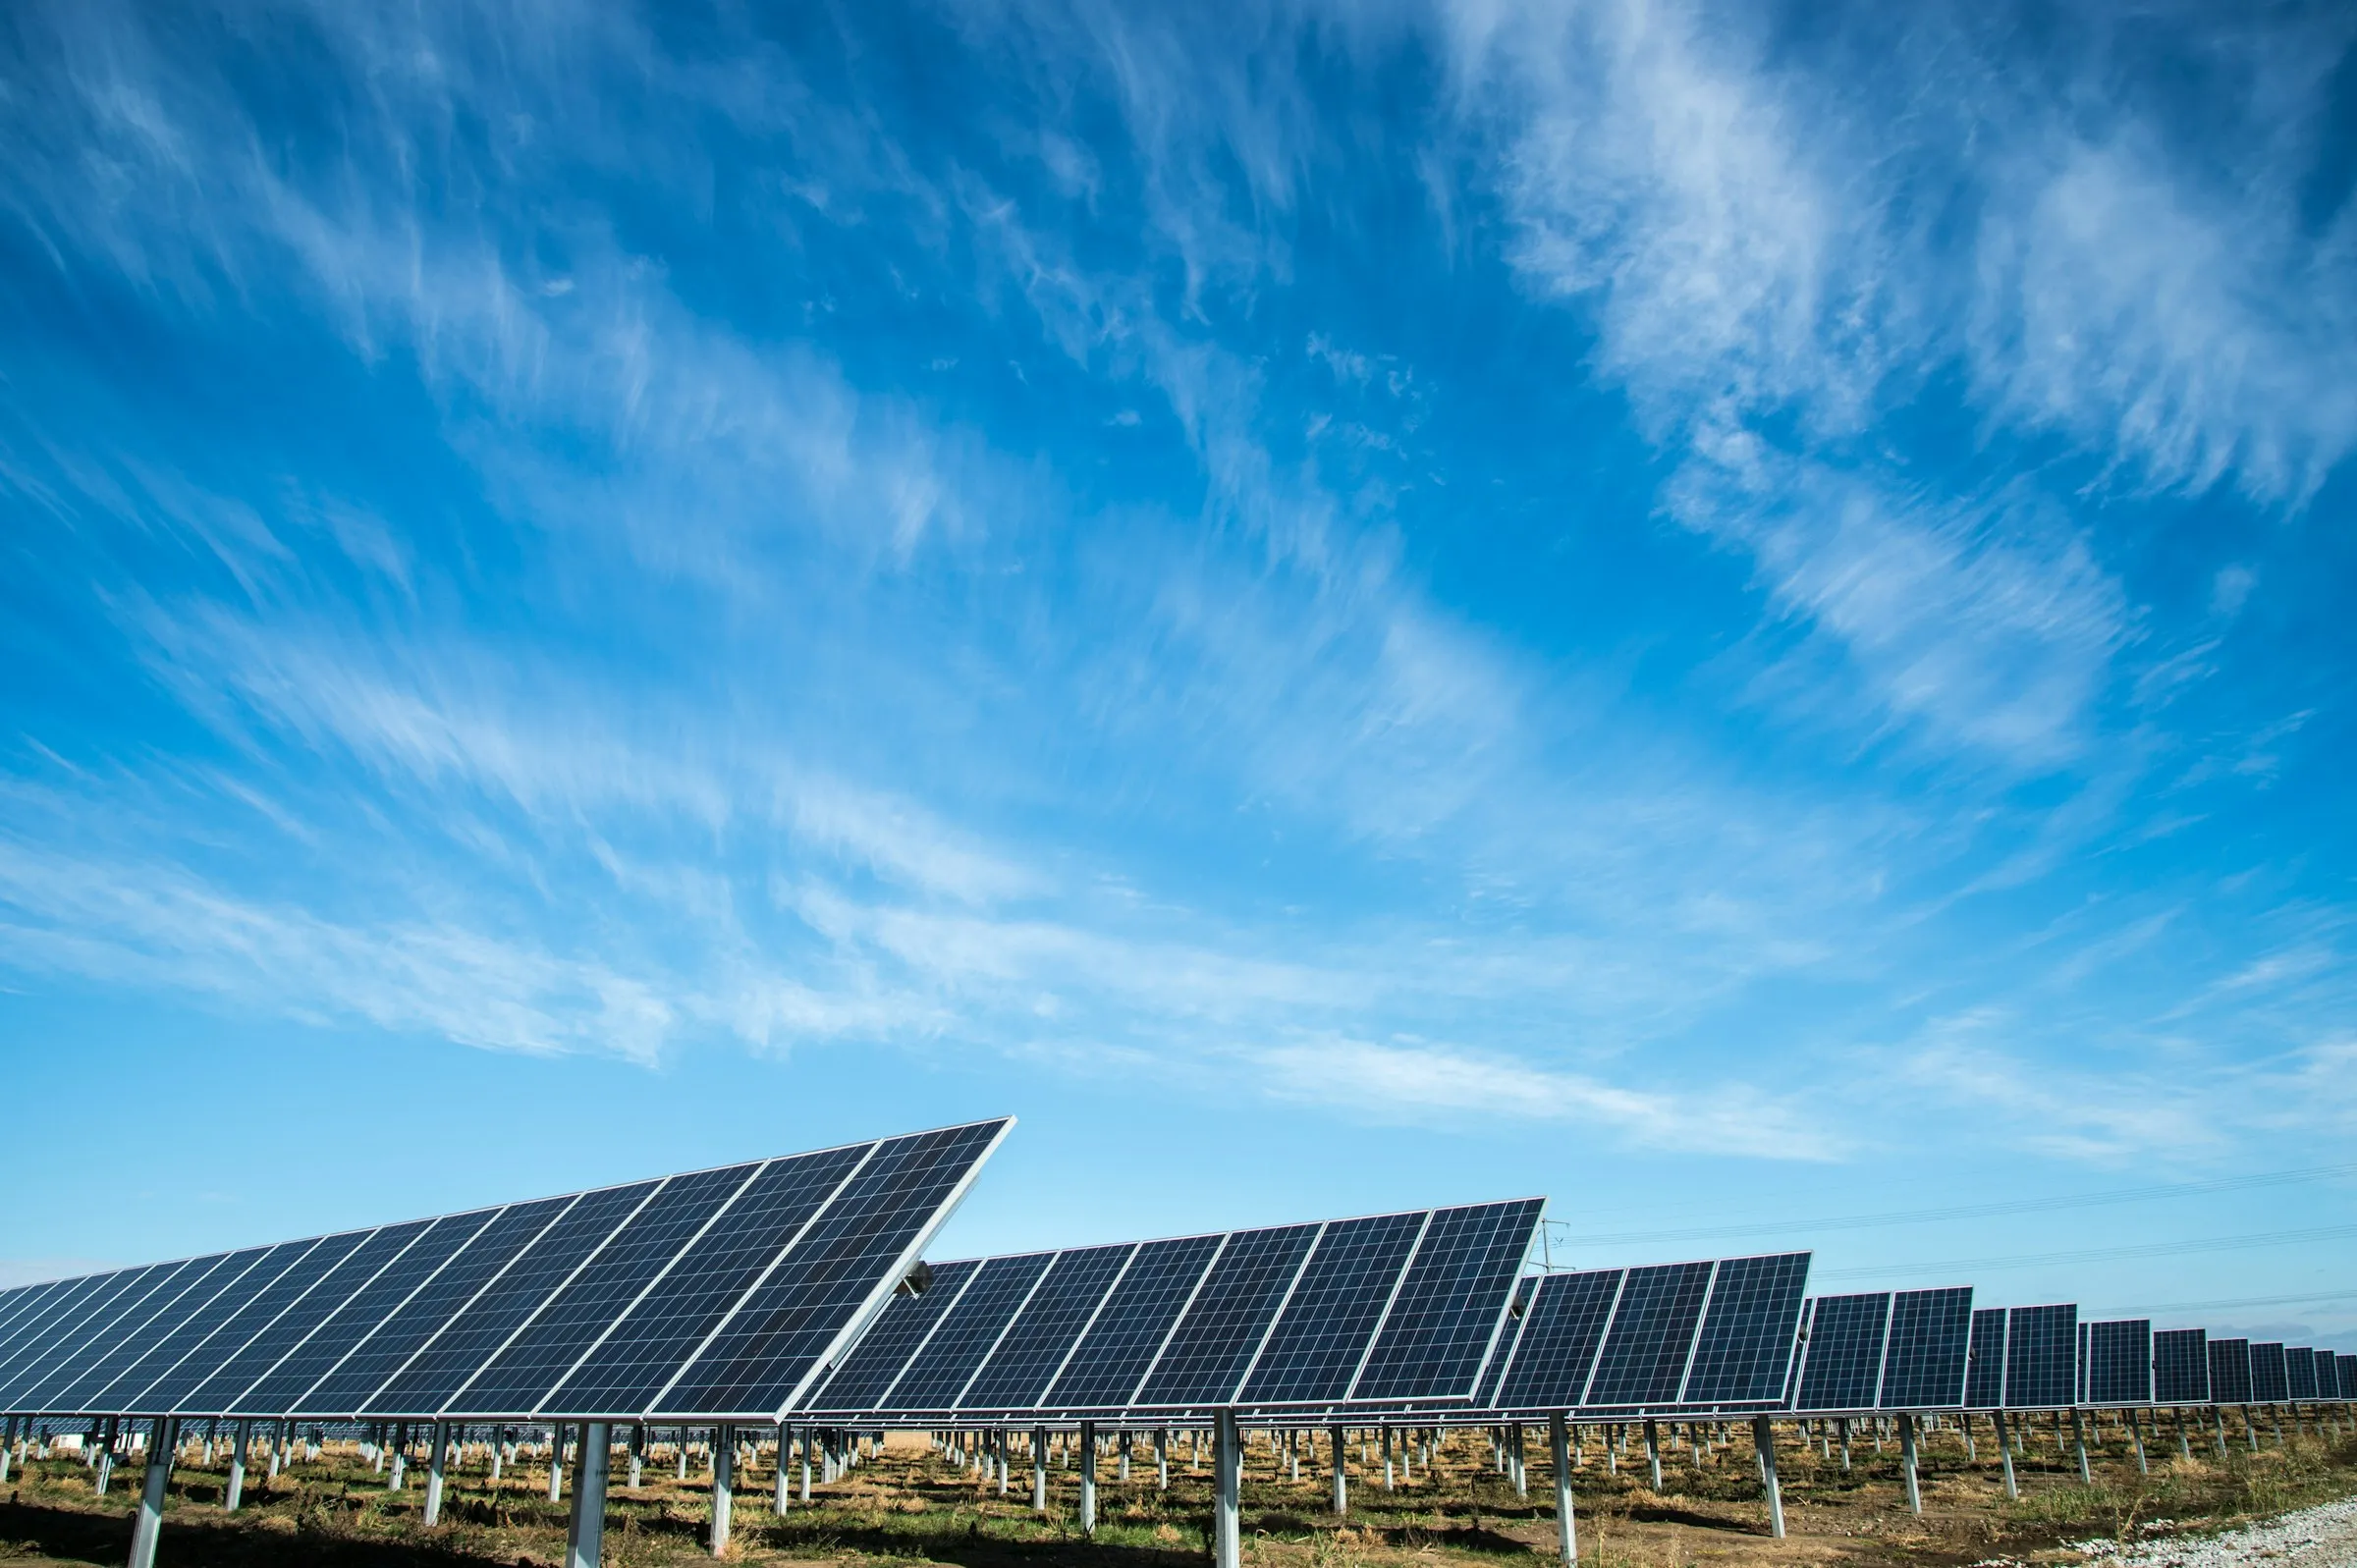
Energy and utilities
An energy data platform on Azure
Bring business-application data into an Azure platform and make it available for analysis in Power BI.
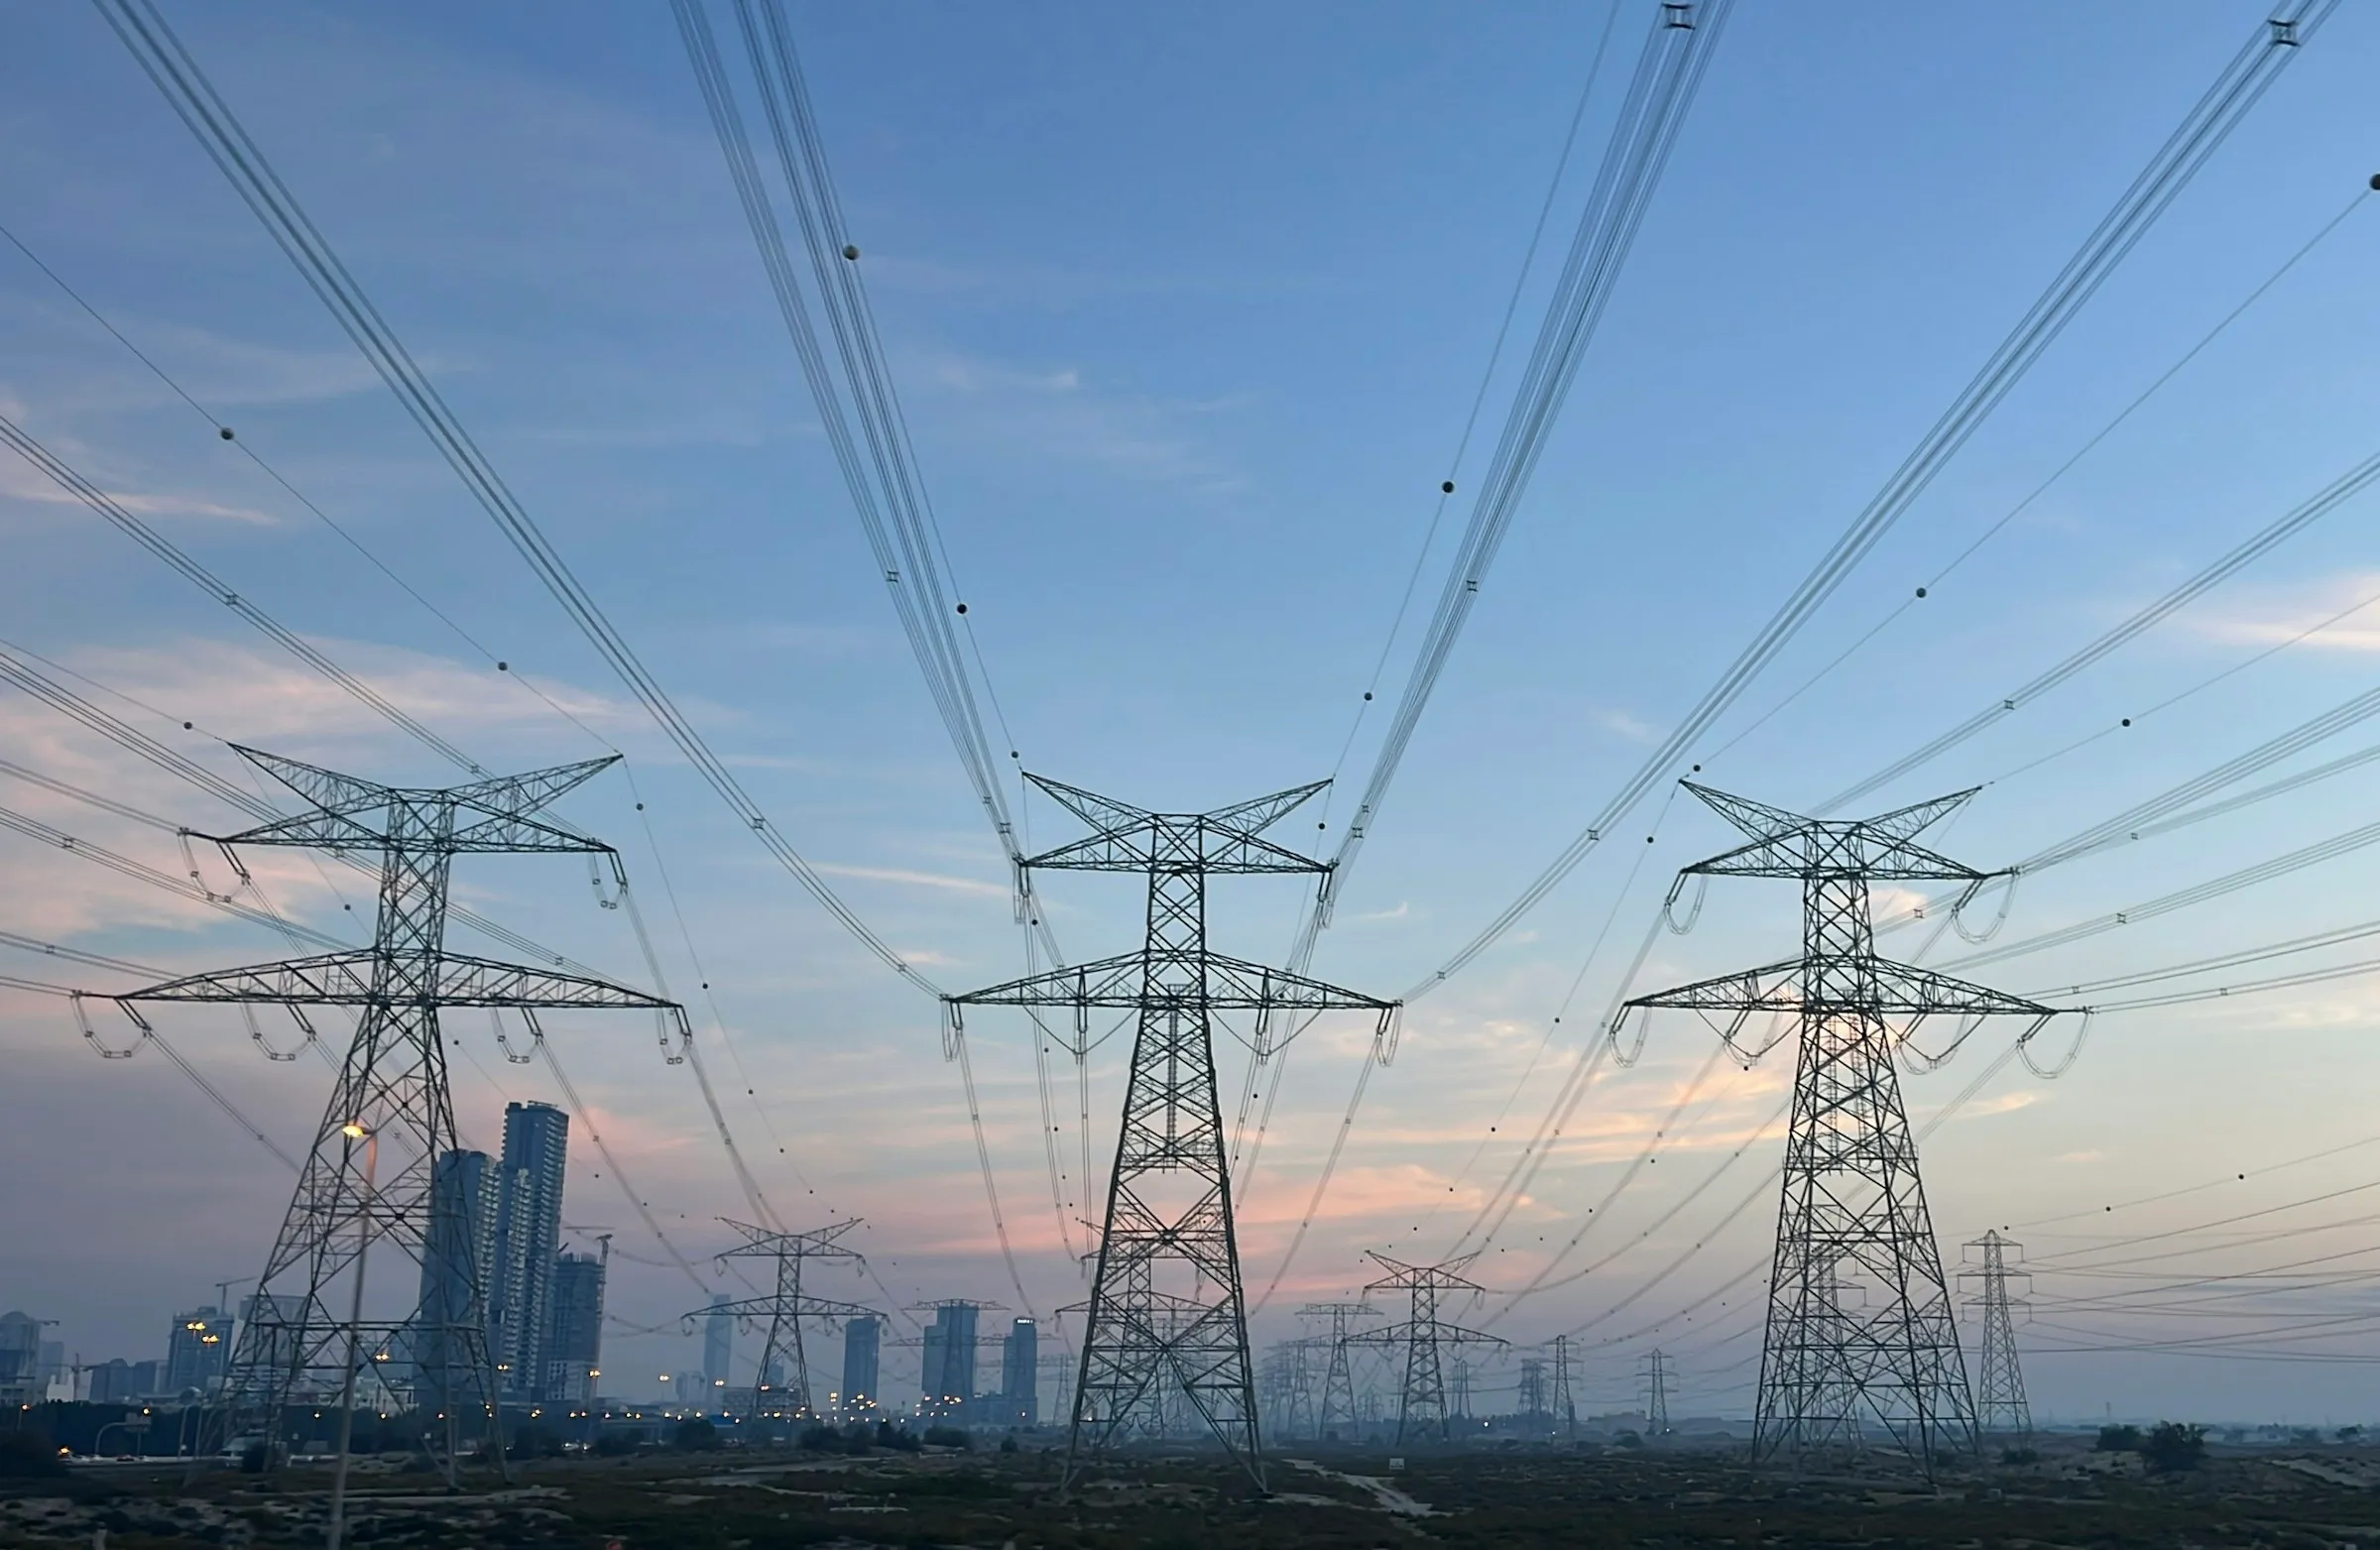
Energy and utilities
From market publication to SQL time series
Turn electricity-market publications into historical price and volume series that can be queried in a SQL database.
Energy and utilities
A Python, R and .NET toolkit for electricity-market forecasts
Receive electricity-market forecasts for thirteen countries continuously, keep them in local databases and make them available to analysts through dashboards and R tools.
Other sectors
Banking and insurance
Data warehouses, applications and APIs for banking data, financial markets and insurance operations.
Logistics and supply chain
API, application and data-platform development for transport and logistics.
Manufacturing
Data platforms, software and analytical services for manufacturing.
Discuss your project
A discussion of your project’s design, development and production deployment.