Solution
Predictive analytics and anomaly detection
Analytical and forecasting models, time series processing and anomaly detection, with data pipelines and services for application integration.
Architecture and implementation
Data preparation and modelling
Dataset preparation, feature engineering and statistical processing.
Forecasting and detection
Training and comparison of regression, time series forecasting and anomaly detection models.
Results integration
Results published through APIs and integrated into dashboards and software.
Design decisions
Construction of a machine-learning pipeline with feature engineering, training, evaluation on a separate test set and an inference API. Features use information available at prediction time so future data cannot distort the evaluation.
Illustrative implementation
A time-series forecast can be evaluated across successive periods before API exposure, retaining the model version and calculation inputs.
Engineering outputsFeature pipeline, evaluation protocol, versioned model and prediction service
Related projects
An Azure platform brings equipment measurements together with business data, retains their history and runs forecasting models. One application is monitoring a group of solar installations, comparing measurements across sites and publishing generation forecasts in dashboards or applications.
 Azure Storage
 Business Central
 Azure Data Factory
 Docker
 .NET
.NET Microsoft Entra ID
 Microsoft Graph
 Power BI
 Python
 Apache Spark
 SQL Server
 Terraform
Components and flows
- Collection of time series, Business Central data and files available through Microsoft Graph
- Retention in Azure Storage, Spark normalisation and loading into SQL Server models
- Python forecasting and publication of historical data and results in Power BI
Development and integration
- Statistical models and machine learning
- Time series and forecasting
- Anomaly detection and segmentation
- Compute services and visualisation
Systems involved
- Warehouses and data platforms
- Python, R and analytical environments
- Applications, APIs and BI tools
Service lineData →
Services by sector
Explore the engineering services offered across different sectors.
Energy and utilities
Forecasts and calculation services
Preparation of training and evaluation datasets, comparison of forecasts with observations and calculation APIs. Parameters and input data are retained for each execution.
Logistics and supply chain
Prediction and processing APIs
Integration of machine-learning models with tracking applications. Feature preparation, input validation and result APIs, with model-version management and evaluation steps.
Manufacturing
Time-series analysis and anomaly detection
Sensor-data preparation, statistical processing and API integration of models. Results are evaluated against identified historical datasets, retaining parameters, versions and execution conditions.
Retail and e-commerce
Sales and inventory analytics
Data warehouses connecting sales, payments, inventory movements and returns. Indicators use consistent references and periods, with data preparation for forecasting and demand analysis.
To go deeper
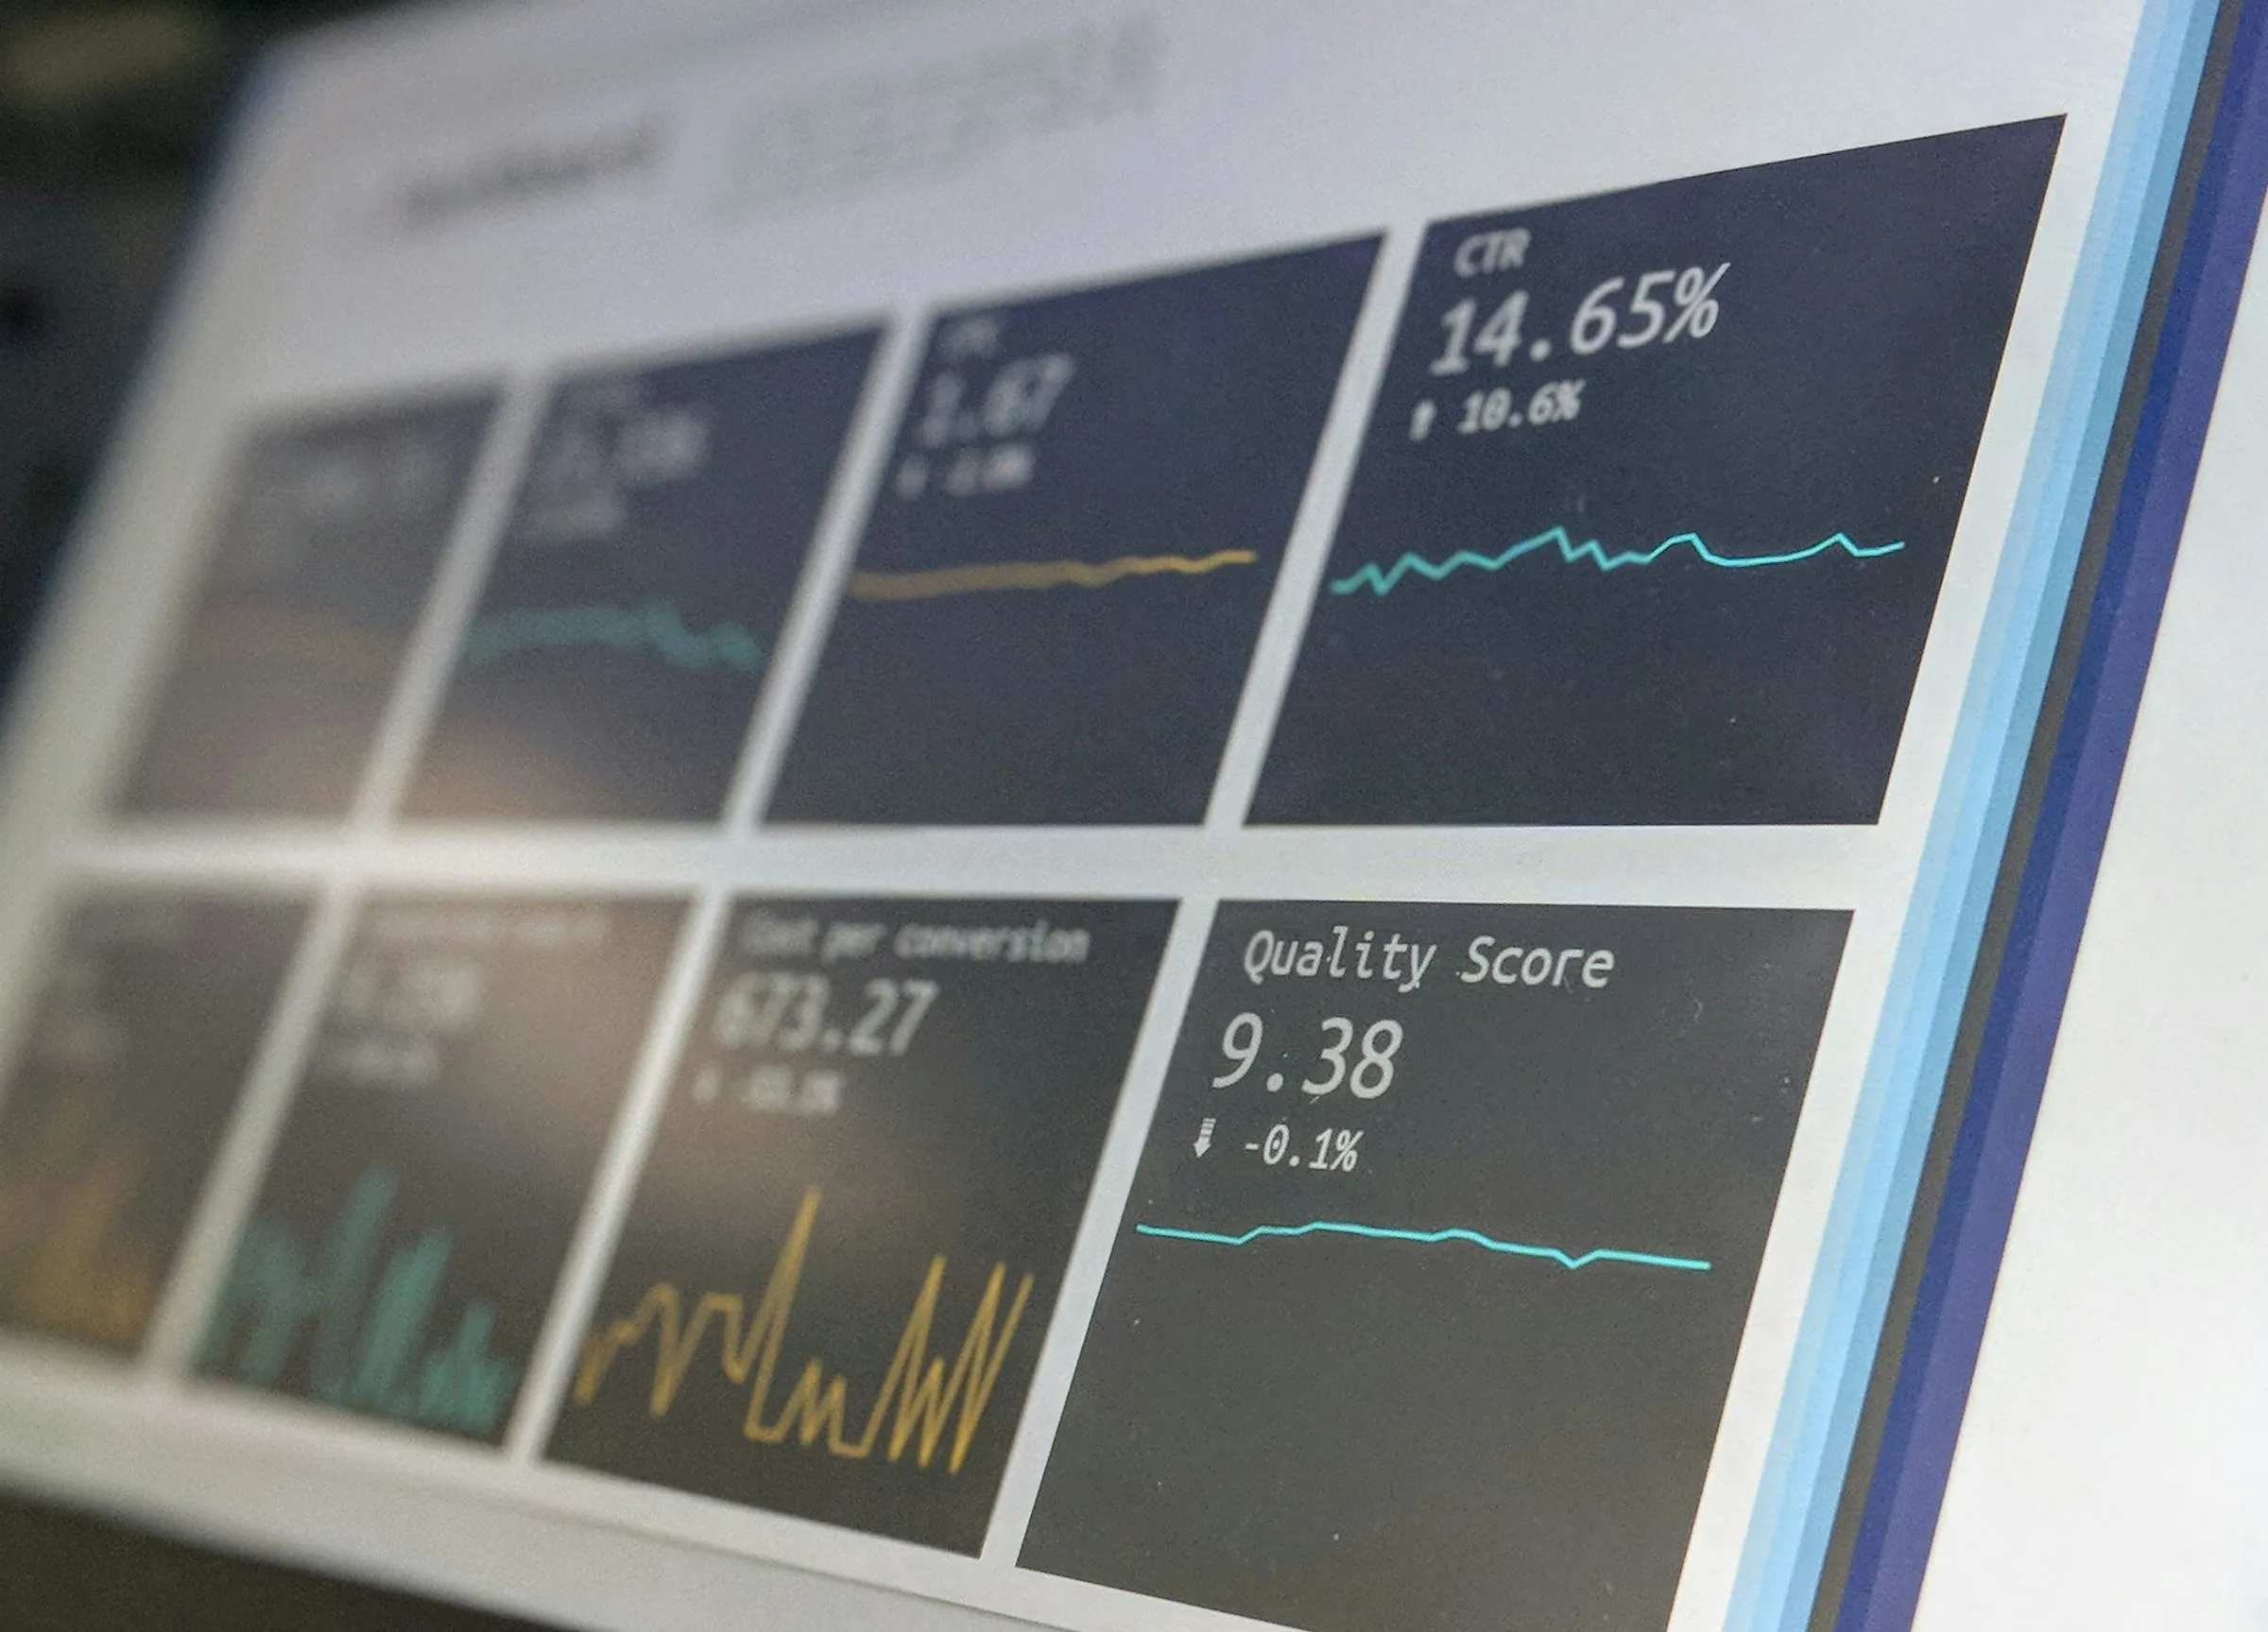
A data platform for analytics, applications and AI
Data models, history and publishing interfaces that connect a data warehouse to analytical queries, applications and predictive models.
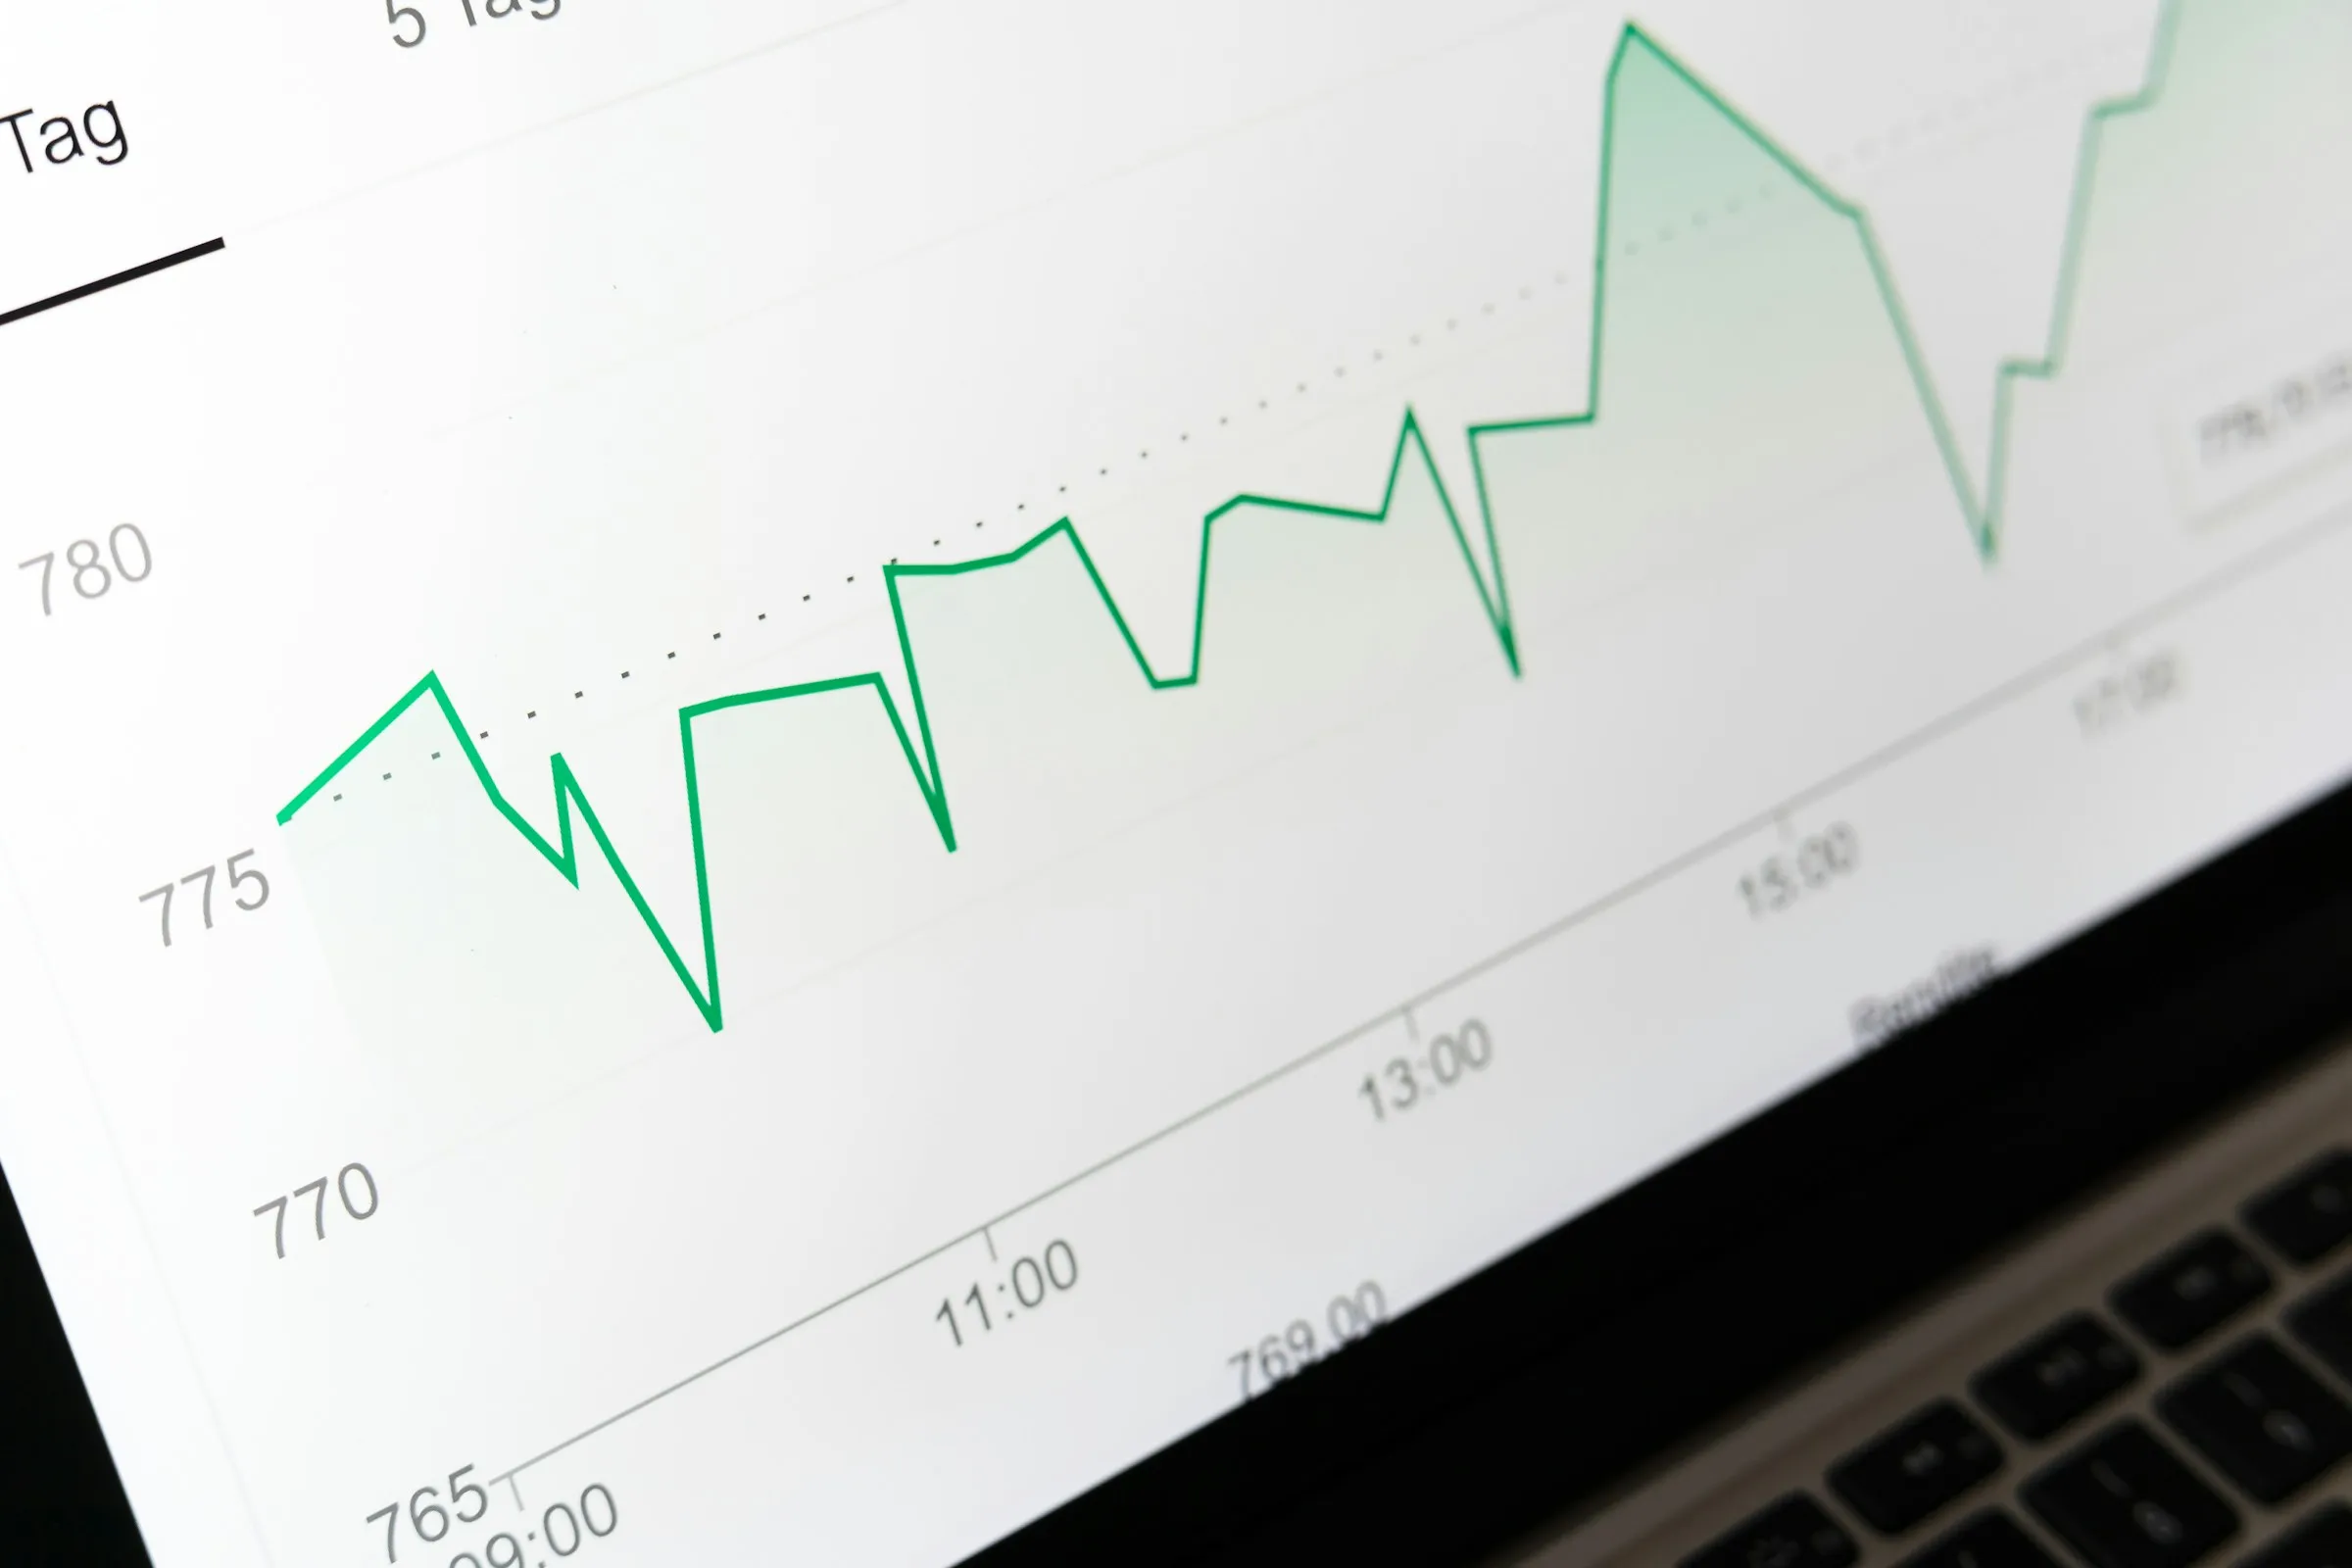
Reliable reporting without replacing every tool
Defined metrics, identifiable sources and a tested first pipeline provide a foundation that teams can explain and extend.
Discuss your project
A discussion of your project’s design, development and production deployment.